5 best investment research websites in 2026

It is 2026 and the stock market landscape is evolving fast. I've been monitoring Reddit forums and X from the perspective of a retail investors and I can say that today there are too many recommendations coming from social media. Companies like OKLO, RKLB and ASTS are recommended everywhere and they are moving based on stories. Only stories. Their fundamentals are disastrous and they are losing investors' money but the regular guy in r/wallstreetbets doesn't care about boring things like revenue growth, margins and profitability.
Today, more than ever, it is very important for us to use a stock research website that can show the relevant fundamental data for any company. But investment research terminals are usually coming at high cost, right? Not all of them.
| Feature | Stockpicker | TradingView | Koyfin | SimplyWall | Fiscal AI |
| User | Long-term Retail | Day Traders | Pros | Casual Retail | Pros |
| Focus | Fundamental | Charting | Data Depth | Snapshots | Custom Analytics |
| AI Focus | Education | Sentiment | Data Sum. | Visuals | Queries |
| Usability | High | Moderate | Low | High | Moderate |
| Price | $10/mo | $15/mo | $39/mo | $10.95/mo | $49/mo |
Stockpicker.tech - the best investment research website for long term retail investors
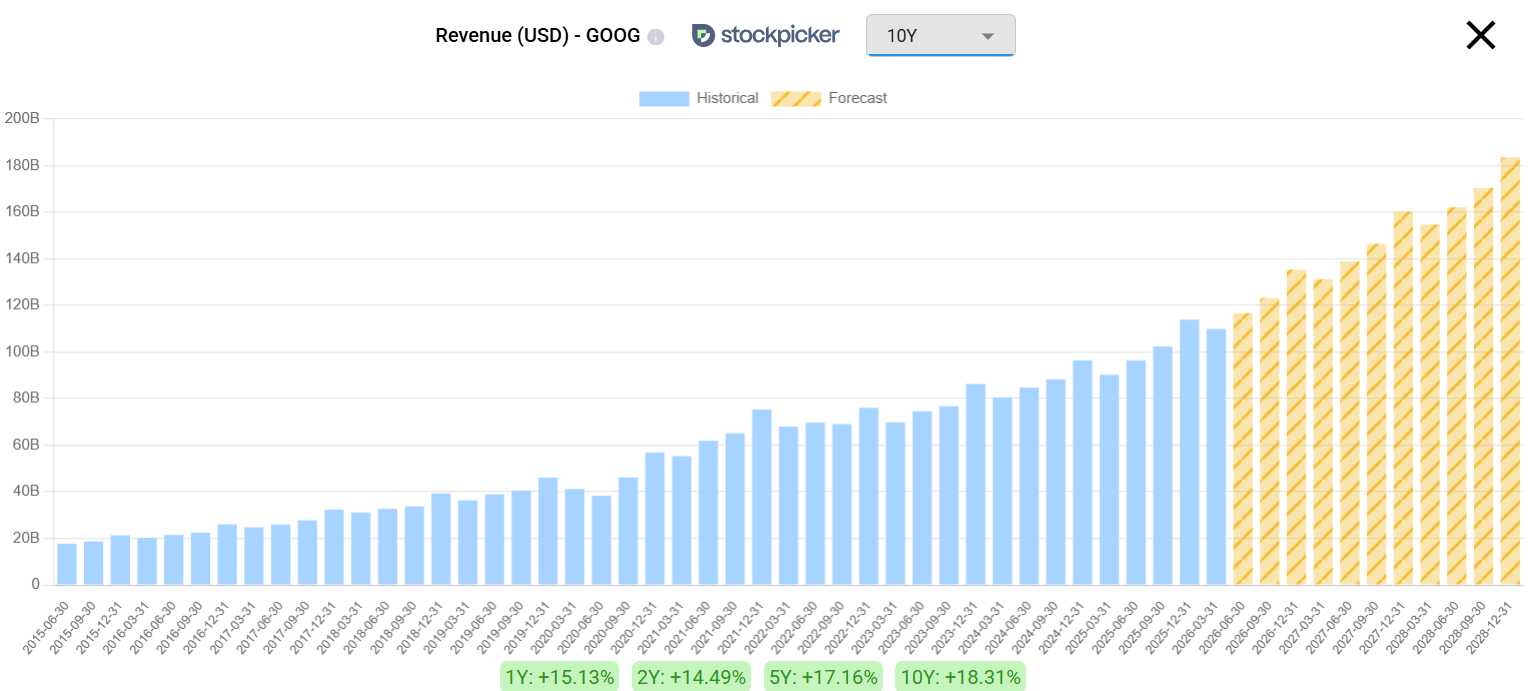
Stockpicker takes the complex data from earnings reports and provides it into clear charts that are easy to understand even if you are not a professional stock analyst.
We have all the fundamentals required to check the growth and financial health of companies.
Here are some of the fundamental metrics available in Stockpicker. We can see them all in comprehensive bar charts:
Revenue - Total sales generated by the company
Net Income - Profit after deducting all expenses and taxes
Operating Income - Earnings before interest and taxes
EBITDA - Earnings begore interest, taxes, depreciation and amortization
Free Cashflow - Cash generated after operating expenses and capital expenditures
Operating Cashflow - the total amount of cash generated from day to day business operations
EPS - profit allocated to each outstanding share
Expenses - CapEx, Research & Development, General & Administrative, Sales & Marketing
Cash & Debt - the total cash and long/short term debt of the company
Debt/EBITDA - measures the leverage of the company and how many years they would need to pay their debt if earnings remain constant
Gross Margin - the percentage of revenue the company retains after directing direct cost of acquiring the revenue
Operating margin - the percentage of revenue left after deducting day to day operating expenses
Return on capital employed - shows how much operating profit is generated for each dollar of capital invested, including the cash of the company
Return on invested capital - the percentage return on the money the company actively invests in its business, including debt and equity
Shares Outstanding - total number of shares outstanding
Enterprise Value - the value of the company including market capitalization, debt and cash
There are also charts with the most important valuation metrics. I believe that the best way to evaluate a company is to compare the current ratios to the historical values. This is easy to do with Stockpicker as the charts show exactly that:
Price/Earnings - measures the current price versus the TTM EPS. It tells us how much investors are willing to pay for $1 of profit. Good for profitable companies
Free cashflow yield - measures how much cash the company generates compared to the market value. Good for cash generating companies
Price/Sales - measures how much investors are willing to pay for each dollar of revenue the company generates. Good for immature companies who haven't turned profitable yet(or have recently turned profitable)
Price/Operating Cashflow - measures how much investors are willing to pay for each dollar of cash generated from the business operations of the company. Good for cash generating companies who are heavily reinvesting in the business
EV/EBITDA - measures the total value of the company to its operational earnings
Price/Book - measures the price against the net assets. Good to evaluate asset heavy companies like banks
Stockpicker also offers AI analysis - AI answers pre-defined questions that every investor should ask(e.g. How does the company make money?). This is crucial as it adds valuable context to the numbers and helps the investor conduct the research.
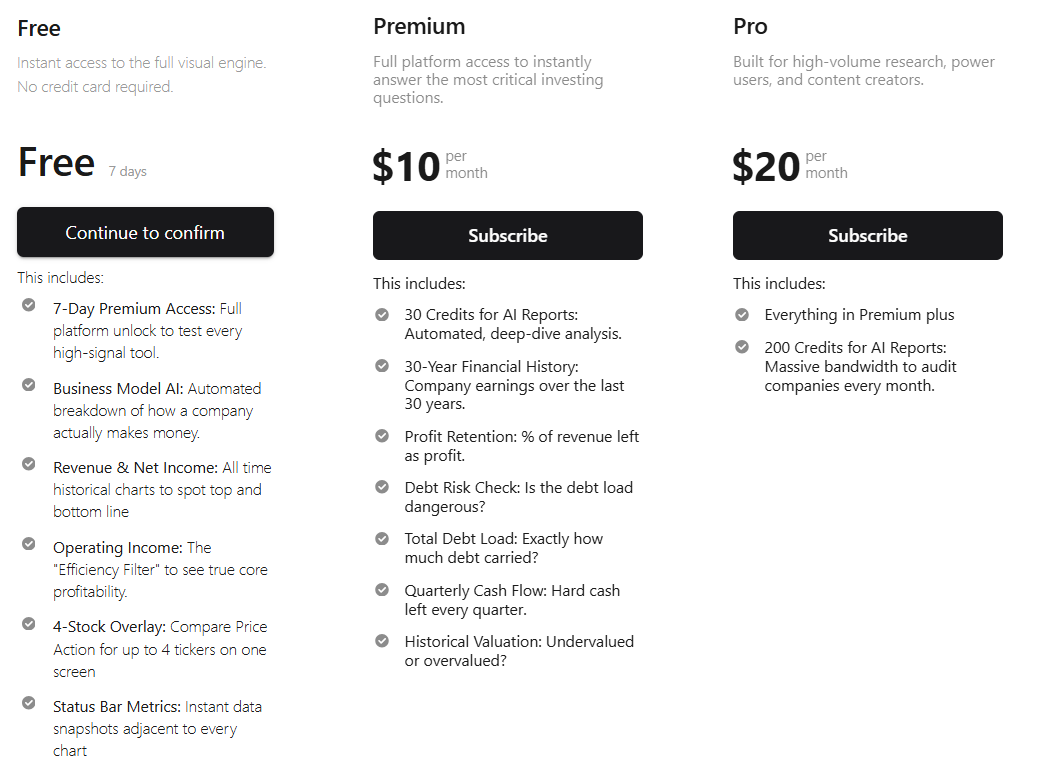
We have made Stockpicker available for anyone. Retail investors usually DCA on montly base when they get their paycheck. It doesn't make sense for an investor who has $500 or $1000 available to invest every month to put $50 or $100 for a professional investment research terminal.
That is why the price tag for Stockpicker is very generous. The full functionality of the platform is available for only $10 per month. It also provides a 7 day free trial with no credit card required. We want to ensure that the capital is allocated where it needs to be - in the investment portfolio.
Website: https://www.stockpicker.tech/
Tradingview - the best option for day traders and technical traders
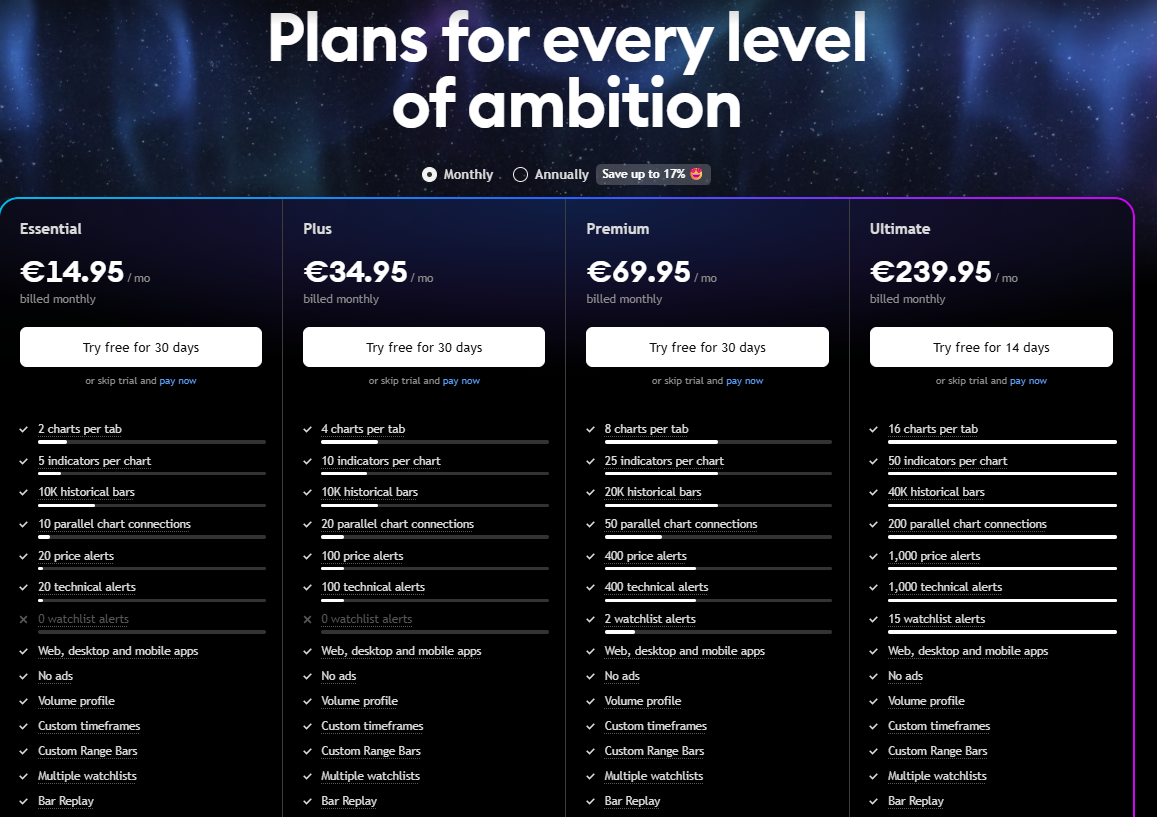
TradingView is a widely used financial charting platform and social network that allows traders and investors to analyze global markets, including stocks, cryptocurrencies, forex, and commodities.
The platform is useful for day traders and technical traders - the added value is through its advanced charts.
They have 4 plans starting from 14.95 EUR. The plans provide more tools on their charts.
Website: https://www.tradingview.com/
Koyfin - alternative to Bloomberg terminal, suitable for professionals
Koyfin is a cloud-based financial data and analytics platform designed as a more accessible, cost-effective alternative to professional tools like the Bloomberg Terminal or FactSet. It is built for professional investors, financial advisors, and researchers who need deep-dive market insights.
It is more suitable for professionals as the price tag starts from $39
Website: https://www.koyfin.com/
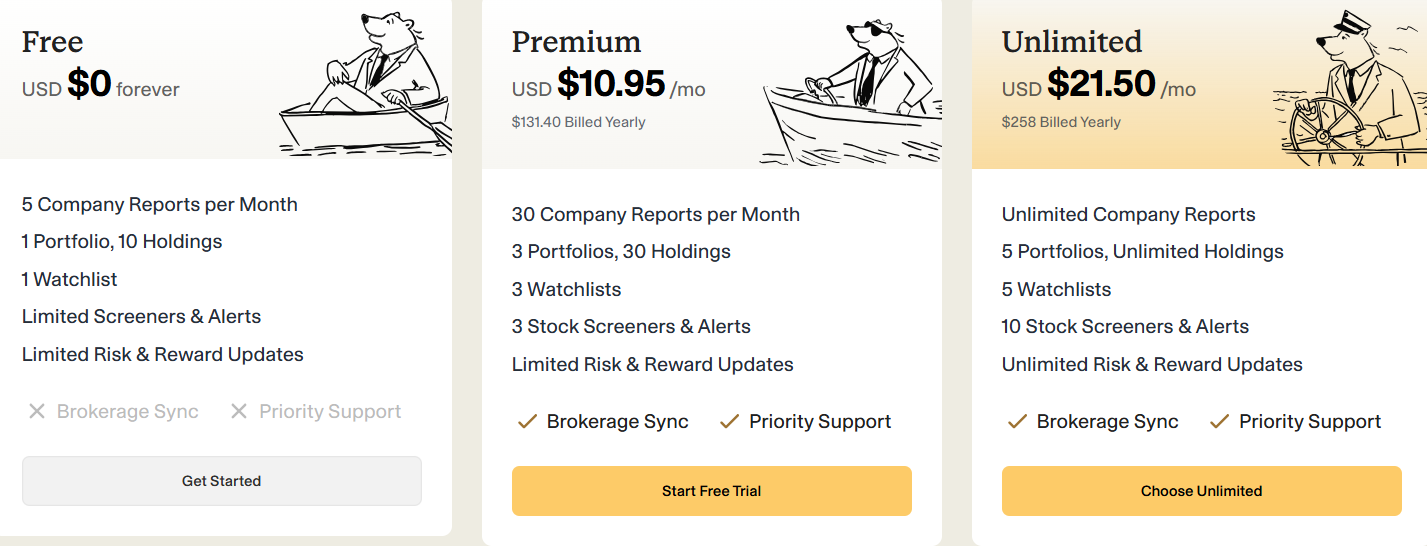
Symplywall.st - The snowflake visuals
Simplywall St is a platform that visualizes financial data to help everyday investors analyze stocks and track their portfolios. Their way to do it is through the so called snowflakes.
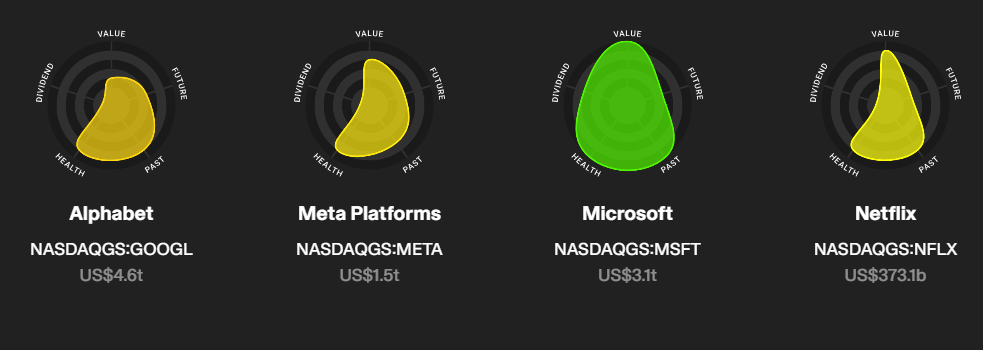
They have a reasonable free plan with 5 company reports per month with specific metrics selected by the platform. Their premium plan includes 30 company reports per month for $10.95.
Website: https://simplywall.st/
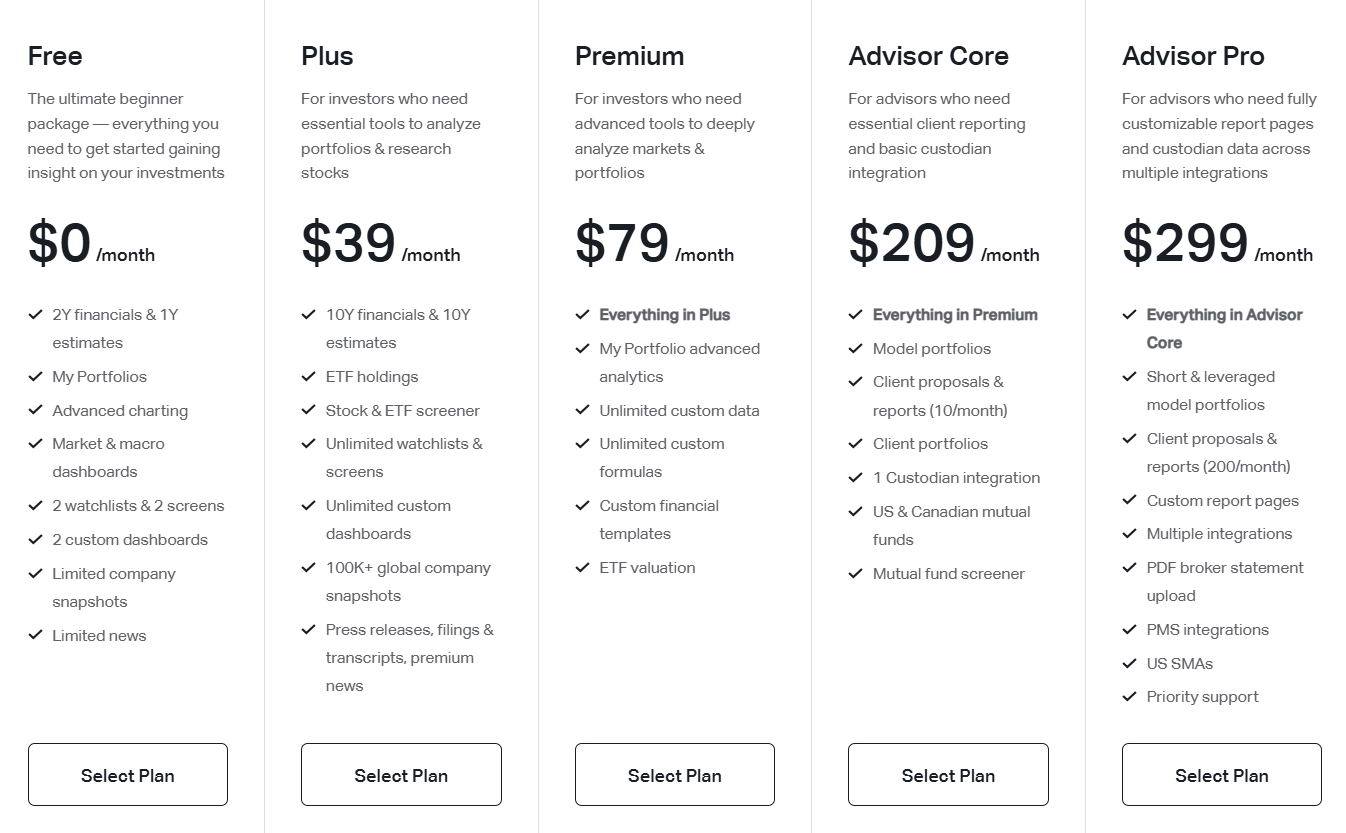
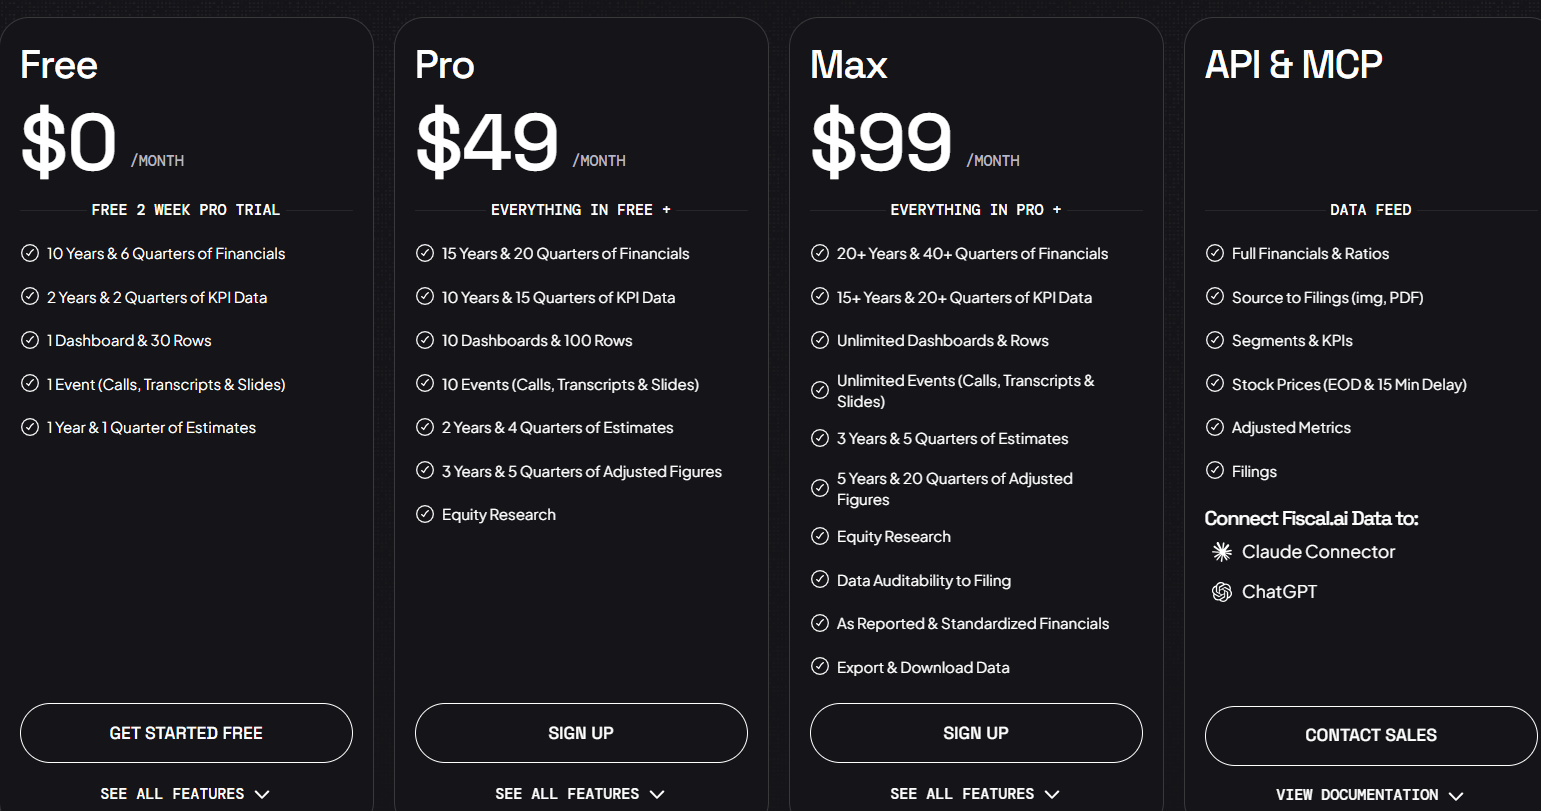
Fiscal AI - a great option for profesionals
FIscal AI is an investment research terminal that provides users with control. You can compare custom metrics of different companies. They also provide great non financial KPI for the big companies which is useful for deep analysis.
The price tag of $49($39 if billed annually) for their cheapest plan makes them a good option for professional investors.
Website: https://fiscal.ai/
Conclusion
One thing is clear - in 2026 you cannot afford to invest blindly without checking company fundamentals and you must chose an investment research terminal. Stockpicker.tech stands out as the investment research website that provides all necessary tools for retail investors with the lowest price tag of $10 per month.